Fig. 1
From: Network model and analysis of the spread of Covid-19 with social distancing
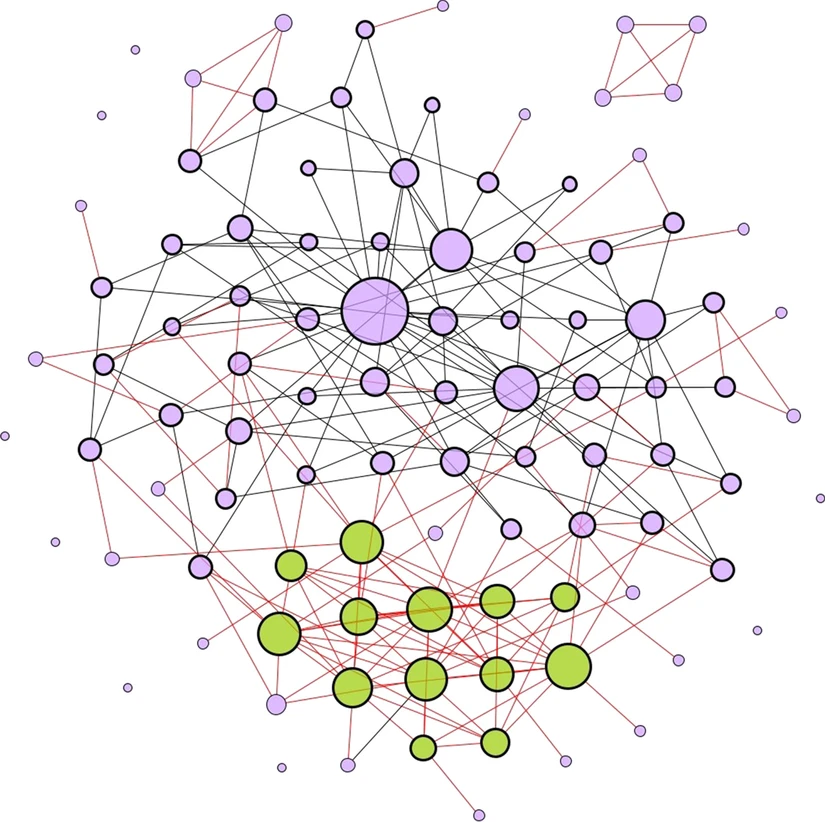
Illustration of the result of the network generation method on a population of 100 individuals. The edges represent interactions within families, workplaces, and social interaction. The red color edges are the ones that are preserved in the lockdown while the black color edges are deleted. The 4-cliques with red edges, as well as a fraction of 3-cliques with red edges represent families. Node size denotes the degree of the node with isolated nodes having the smallest size; this illustrates that the network contains high-degree hubs. The nodes that have a thick border denote the people who are working. Nodes in green color denote essential workers. The cluster of green nodes shows a high interaction among essential workers